EUR/USD was trading calmly on the first trading day of the week... until it didn't. The pair jumped in the U.S. session after the release of the ISM Manufacturing Index. Overall, the pair continues to trade more sideways than upward over the past two weeks. However, it is unlikely for the pair to show flat movement in the next couple of days, as we expect a lot of important information from the U.S. and the EU.
Some might think that the key event of the week is the European Central Bank meeting scheduled for June 6. We believe that this is not exactly the case, and that traders shouldn't expect much from the ECB. Let us try to explain why. First, since February, the ECB, represented by Christine Lagarde and other officials, has been preparing the market for a rate cut in June. This means the market has clearly known and understood for that there is a high likelihood the rate will be lowered for the first time in the first month of summer. As inflation in the Eurozone slowed, confidence only grew. Now, although inflation accelerated to 2.6% in May, the ECB is still very close to the first monetary policy easing. Accordingly, the market has had enough time to price in this event in advance. The only question is whether it has already done so.
Secondly, at the press conference, Lagarde is likely to limit herself to general and very cautious statements. It should be understood that with a key rate of 4.5% (which is one of the lowest among major central banks), the ECB will be the first to start the rate cut cycle. Yes, there are significant reasons and grounds for this, but at the same time, the central bank is unlikely to rush with the process of monetary easing. Therefore, Lagarde will probably say that the first rate cut does not mean that the ECB will lower rates at every subsequent meeting. She may also say that the ECB will act cautiously and will pause indefinitely at the slightest slowdown in the decline of inflation.
An alternative scenario may show the ECB keeping its rate at the current level. In this case (without a doubt), the market will use this to open new long positions on the euro. The single currency has been growing for a month and a half, often without any substantial reasons. In the last two weeks, it hasn't even been able to correct lower. Therefore, if the ECB makes a more hawkish decision than the market expects, it is certain that the euro will rise again. However, the probability of this alternative scenario is still low. We believe that this week's U.S. data will have more impact on the market and the EUR/USD pair.
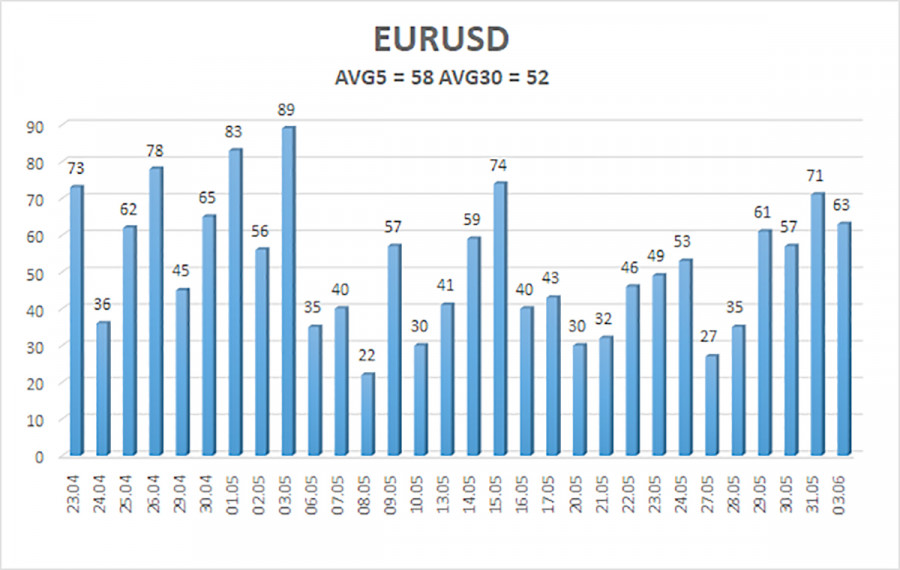
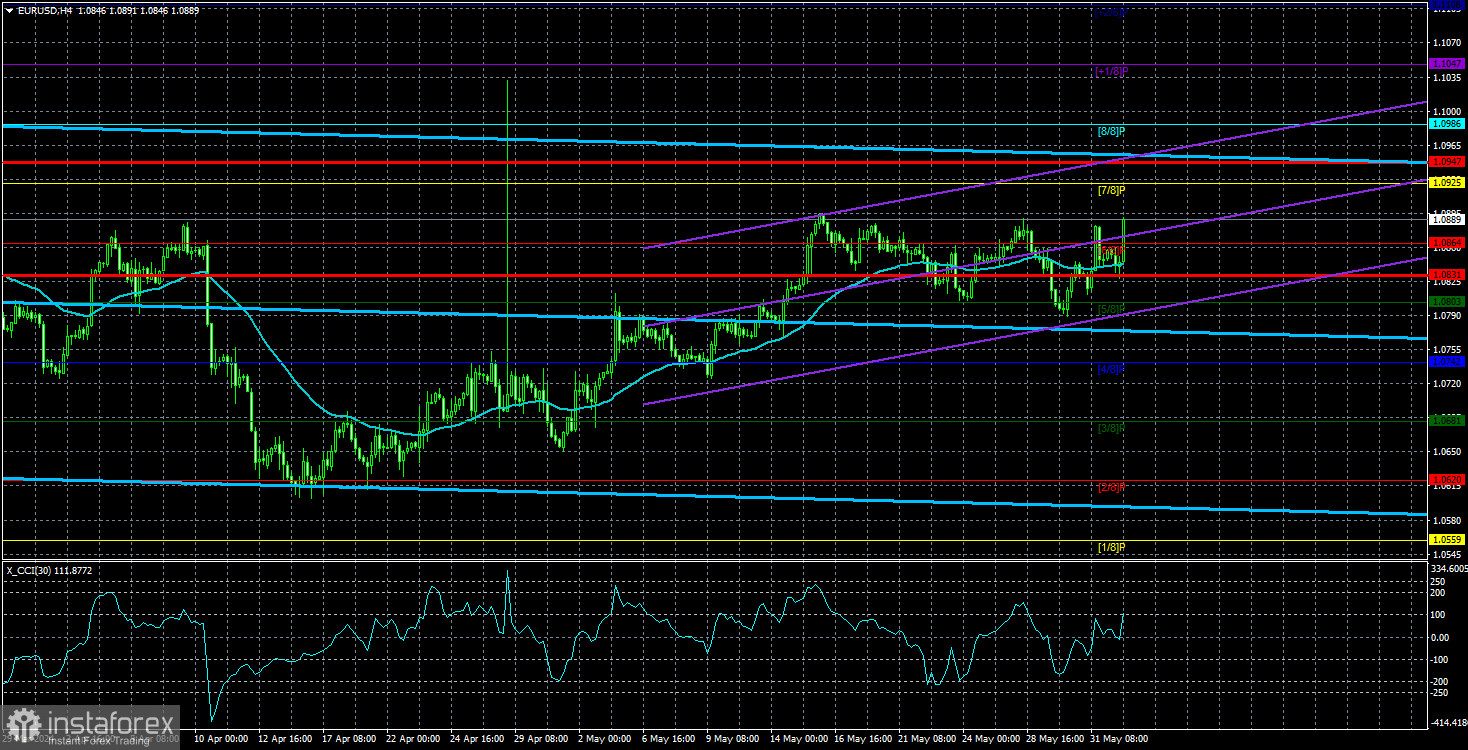
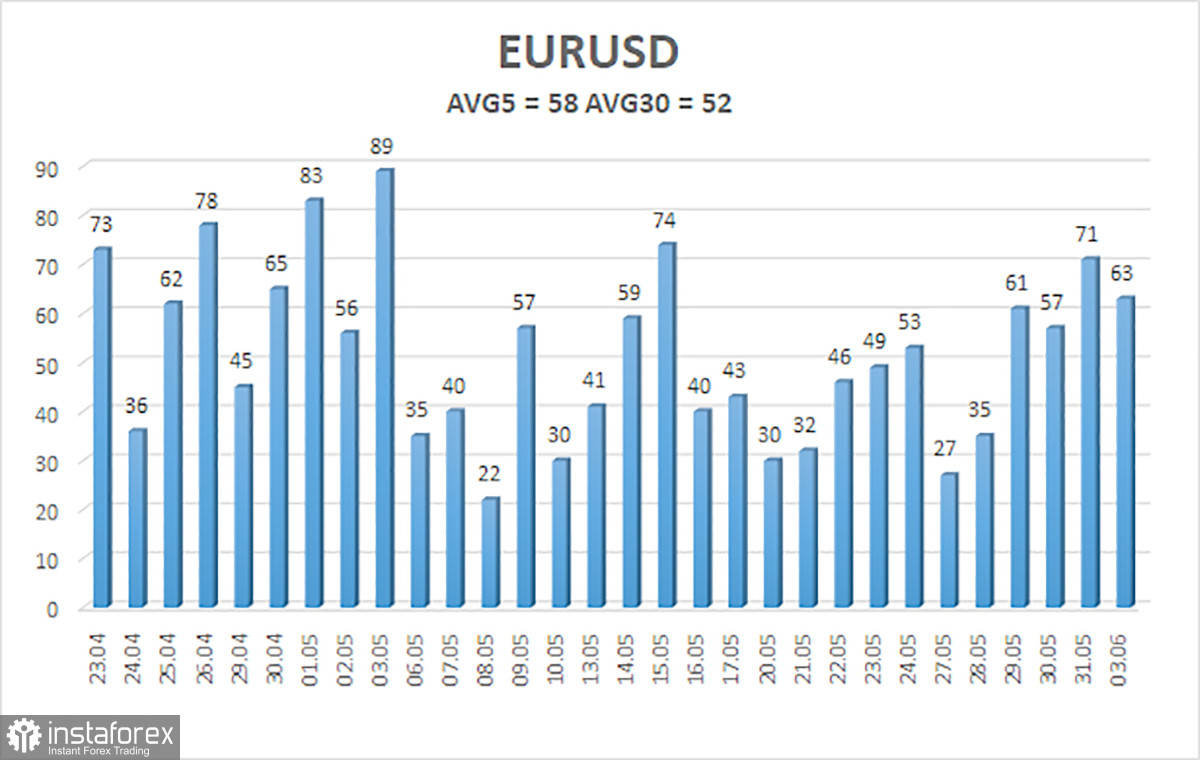
The average volatility of the EUR/USD pair over the last five trading days as of June 4 is 58 pips, which is considered an average value. We expect the pair to move between the levels of 1.0831 and 1.0947 on Tuesday. The higher linear regression channel is directed downward, so the global downward trend remains intact. The CCI indicator entered the oversold area in April, which triggered the upward movement. However, the bullish correction has lasted for a long time so it's difficult to expect it to end anytime soon.
Nearest support levels:
S1 - 1.0864
S2 - 1.0803
S3 - 1.0742
Nearest resistance levels:
R1 - 1.0925
R2 - 1.0986
R3 - 1.1047
Trading Recommendations:
The EUR/USD pair maintains a downtrend, but the bullish correction remains intact. We cannot confirm that it has definitely ended. The euro should resume its downward movement in the medium term, but the market continues to interpret almost every event against the dollar. The single currency often rises even in the absence of news and reports. We believe that this will not last forever. You may consider selling the euro if the price consolidates below the moving average. If the price continues to fall, the euro could become much cheaper in the next few months, as the fundamental and macroeconomic background continues to support the dollar. A global downtrend also persists on the 24-hour TF.
Explanation of Illustrations:
- Linear Regression Channels – Helps determine the current trend. If both are directed in the same direction, it means the trend is currently strong.
- Moving Average Line (settings 20.0, smoothed) – Determines the short-term trend and the direction in which trading should currently be conducted.
- Murray Levels – Target levels for movements and corrections.
- Volatility Levels (red lines) – The probable price channel in which the pair will spend the next day, based on current volatility indicators.
- CCI Indicator – Its entry into the oversold area (below -250) or the overbought area (above +250) means that a trend reversal in the opposite direction is imminent.