GBP/USD traded in a fairly calm manner until the U.S. ISM manufacturing report was published. Take note that this index is quite important and is much more significant than the usual S&P PMI data. The U.S. ISM Manufacturing PMI fell from 49.2 to 48.7 in May. Naturally, the dollar immediately retreated, and the pound sterling surged once again. There is nothing surprising about what happened yesterday. Even if the ISM report had met market expectations, we would still have expected the GBP/USD pair to rise. In recent weeks and even months, the market has been using any formal reason to buy the pound rather than sell it. So what can we say if the ISM index turned out to be significantly worse than market expectations...
This week, the U.S. will release a considerable amount of important information. Therefore, the dollar will have more than one chance to decline. Unfortunately, the U.S. reports have been disappointing in recent months. It's disappointing to the extent that even the fundamental background can't save the dollar from further sell-offs. It's worth noting that the Federal Reserve keeps postponing its first rate cut. To be more precise, the market is constantly expecting the Fed to begin the rate-cutting cycle too early. Therefore, it can be said that the market itself is to blame for its judgments and expectations, as it turns out to be wrong time after time.
However, credit must be given where it's due. Since market participants repeatedly make mistakes, they have simply decided to ignore their own errors. In other words, the dollar should be rising now because expectations of Fed rate cuts in March and June have not materialized. However, the market simply refuses to acknowledge its own mistakes and refuses to buy the dollar based on this fact. Therefore, we face situations where the dollar weakens for a long time because everyone was expecting a rate cut in March, and now it's not rising because the market seems to be turning a blind eye to this factor.
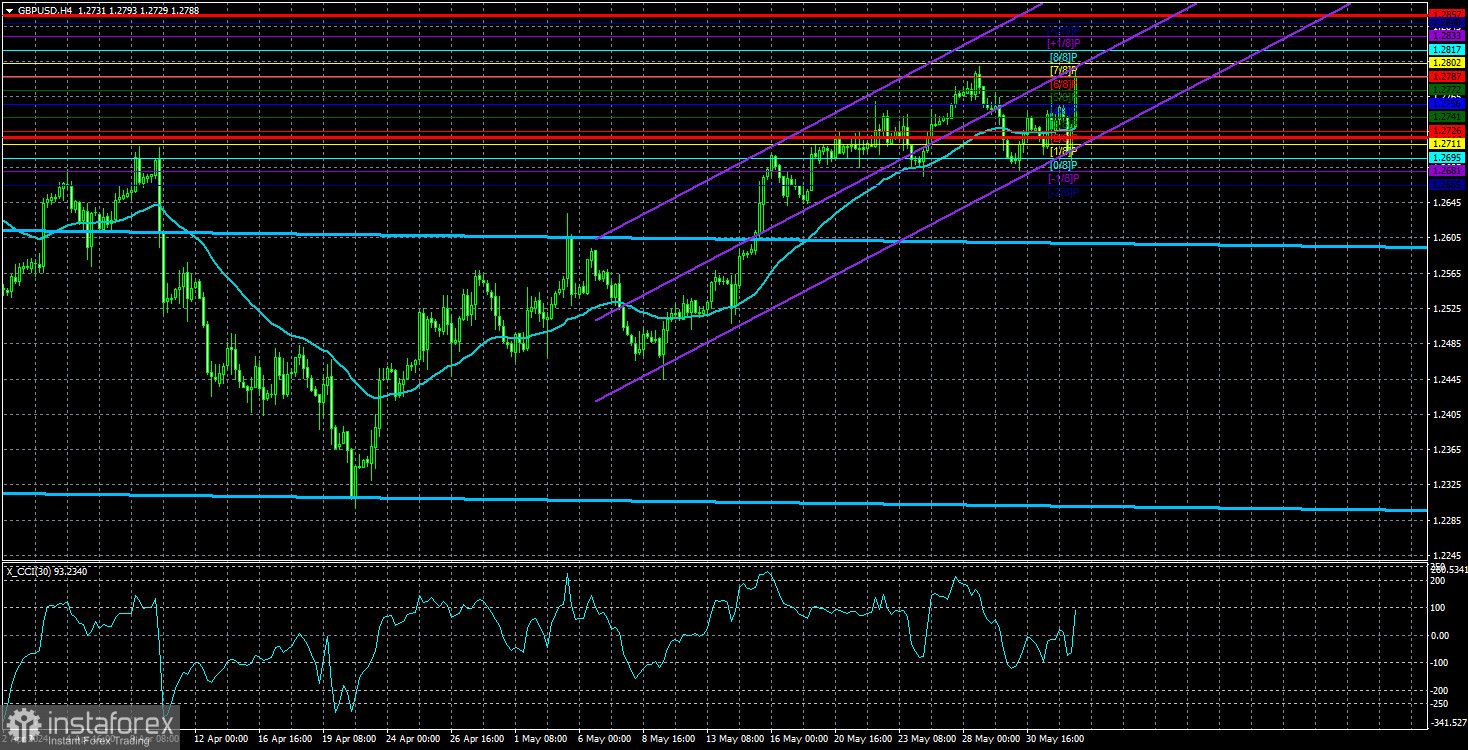
Therefore, the U.S. data will be the main focus this week. If they turn out to be disappointing, as the first report did this week, then we can only expect the dollar to fall. From a technical perspective, everything remains natural, but only on the 4-hour chart. On this timeframe, the upward trend persists, and closings below the moving average don't say much. The trend doesn't shift to a bearish one, even if sell signals are forming. Therefore, traders who trade purely on technicals may continue buying the British pound.
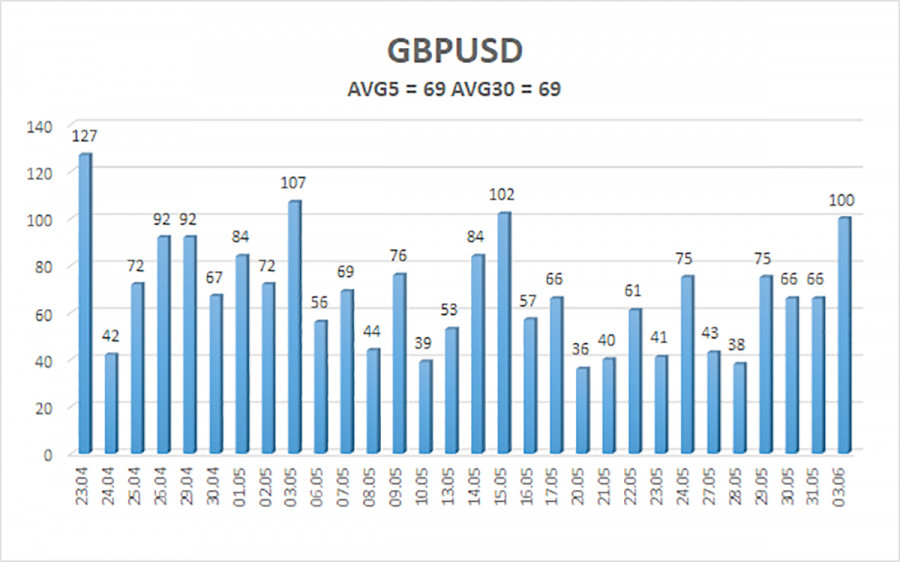
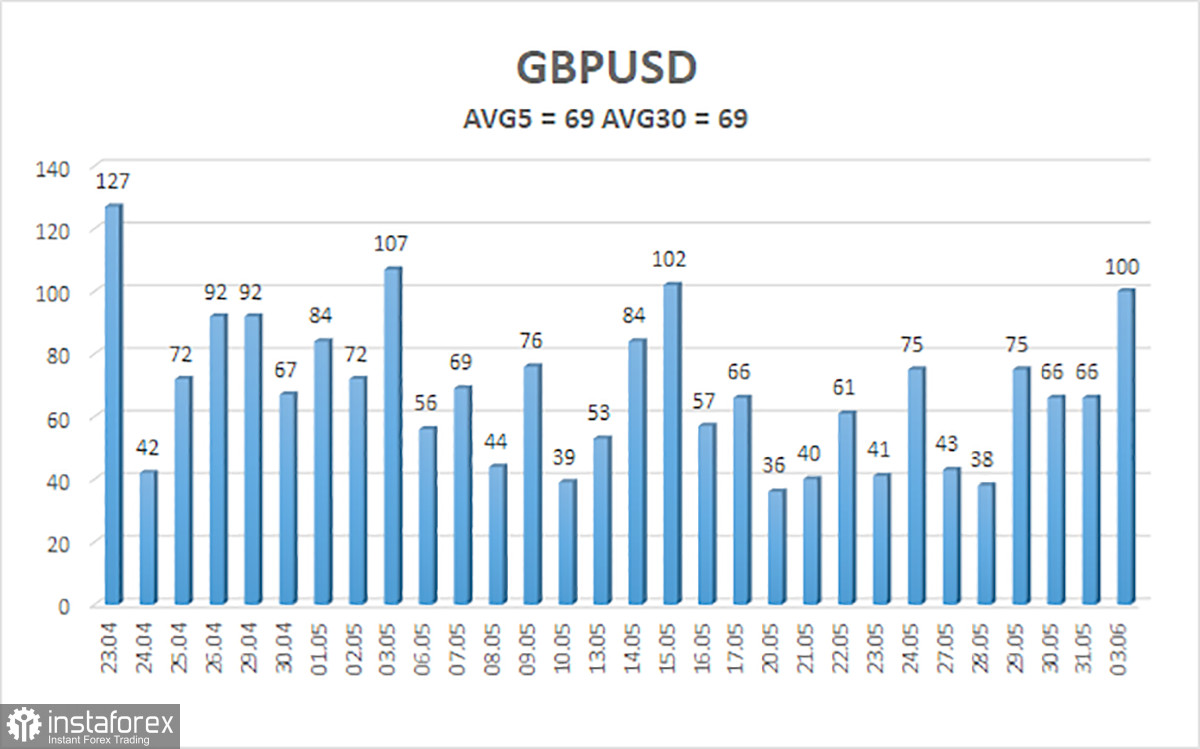
The average volatility of GBP/USD over the last five trading days is 69 pips. This is considered an average value for the pair. Today, we expect GBP/USD to move within the range limited by the levels of 1.2719 and 1.2857. The higher linear regression channel is pointing downwards, suggesting a downward trend. The CCI indicator entered the oversold area three times in May, and the British currency started a new phase of growth. However, this correction should have ended a long time ago.
Nearest support levels:
S1 - 1.2726
S2 - 1.2695
S3 - 1.2665
Nearest resistance levels:
R1 - 1.2756
R2 - 1.2787
R3 - 1.2817
Trading Recommendations:
The GBP/USD pair continues to trade higher. The pound manages to rise even when it has no reason to do so. And even when it does, the growth turns out to be much stronger than one might expect. However, we still expect downward movement, but with the current paradoxical rise of the British currency, we may have to wait for a long time. Short positions remain much more relevant, as most of the factors point downwards. Therefore, you may consider selling the pair with targets at 1.2665 and 1.2604, but only if the price consolidates below the moving average. You may consider longs above the moving average line if you trade solely on technical analysis or if this week's U.S. reports turn out to be weak.
Explanation of Illustrations:
- Linear Regression Channels – Helps determine the current trend. If both are directed in the same direction, it means the trend is currently strong.
- Moving Average Line (settings 20.0, smoothed) – Determines the short-term trend and the direction in which trading should currently be conducted.
- Murray Levels – Target levels for movements and corrections.
- Volatility Levels (red lines) – The probable price channel in which the pair will spend the next day, based on current volatility indicators.
- CCI Indicator – Its entry into the oversold area (below -250) or the overbought area (above +250) means that a trend reversal in the opposite direction is imminent.