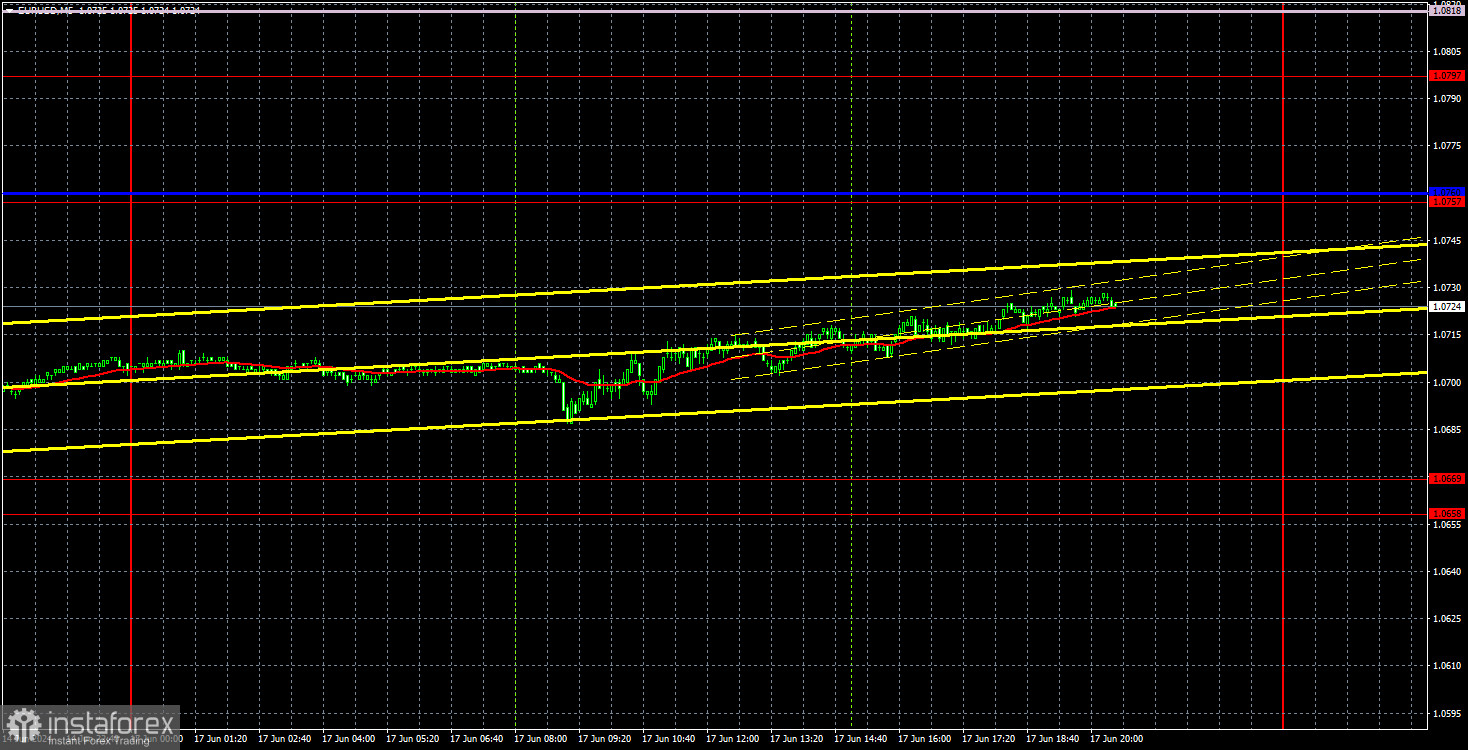
Analysis of EUR/USD 5M
EUR/USD continued to correct on the first trading day of the new week after a perfect rebound from the 1.0658-1.0669 area, which was tested at the end of last week. Therefore, the pair may continue to go through a correction for some time, which aligns with the current technical picture. This week, no significant events or reports are expected in the U.S. or the Eurozone, so the pair's movements may be soft and even sluggish—an ideal time for a correction. The nearest target for the corrective movement is the Kijun-sen line. A rebound from this line could bring back the downward trend, which would be logical.
We don't see any other scenario besides the pair's decline following the European Central Bank's monetary policy easing and the Federal Reserve's refusal to lower rates in the near future. What we have mentioned for many months has now become reality. The ECB started to lower rates first and may continue to do so for some time. Thus, by the end of the year, the rate differential between the ECB and the Fed could be 1.75%. In our opinion, this is enough reason for the single currency to continue the downward movement.
No trading signals were generated on Monday. Throughout the day, the pair did not even attempt to approach any of the important lines or levels. Volatility was low. Therefore, traders had no reasons to open trading positions.
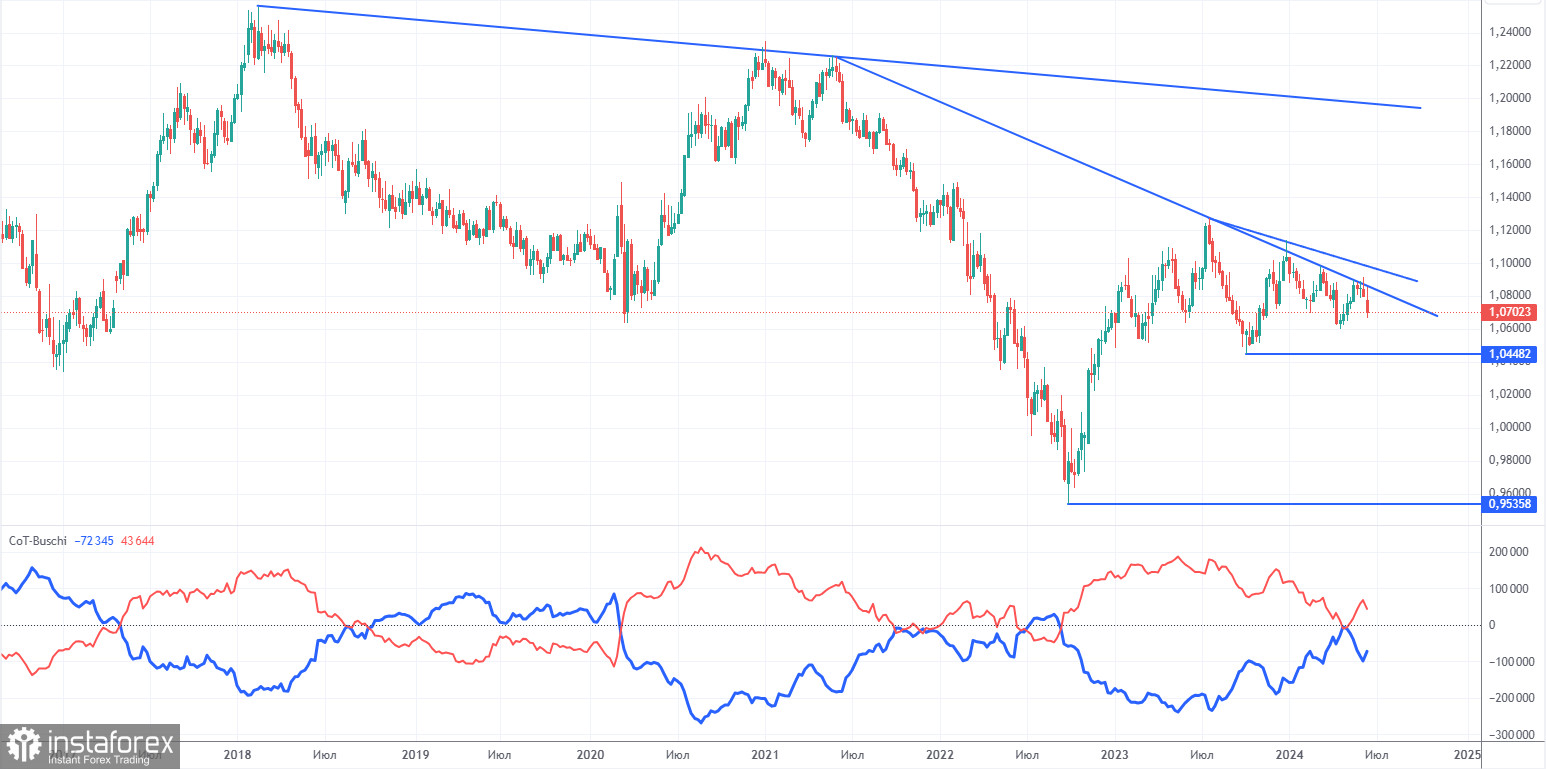
COT report:
The latest COT report is dated June 11. The net position of non-commercial traders has remained bullish for a long time, and we're still dealing with the same situation. The bears' attempt to gain dominance failed miserably. The net position of non-commercial traders (red line) has been declining in recent months, while that of commercial traders (blue line) has been growing. But now we're seeing the opposite once again. This shows that buyers, not sellers, are currently gaining momentum again. This might be temporary since the downward trend is still valid.
We don't see any fundamental factors that can support the euro's strength in the long term, while technical analysis also suggests a continuation of the downtrend. Three descending trend lines on the weekly chart suggests that there's a good chance of further decline.
The red and blue lines are currently moving away from each other again, which indicates a build-up in long positions on the euro. During the last reporting week, the number of long positions for the non-commercial group decreased by 1,200, while the number of short positions increased by 23,000. Accordingly, the net position decreased by 14,200. We may witness the start of increasing bearish pressure. According to the COT reports, the euro has a lot of potential to fall.
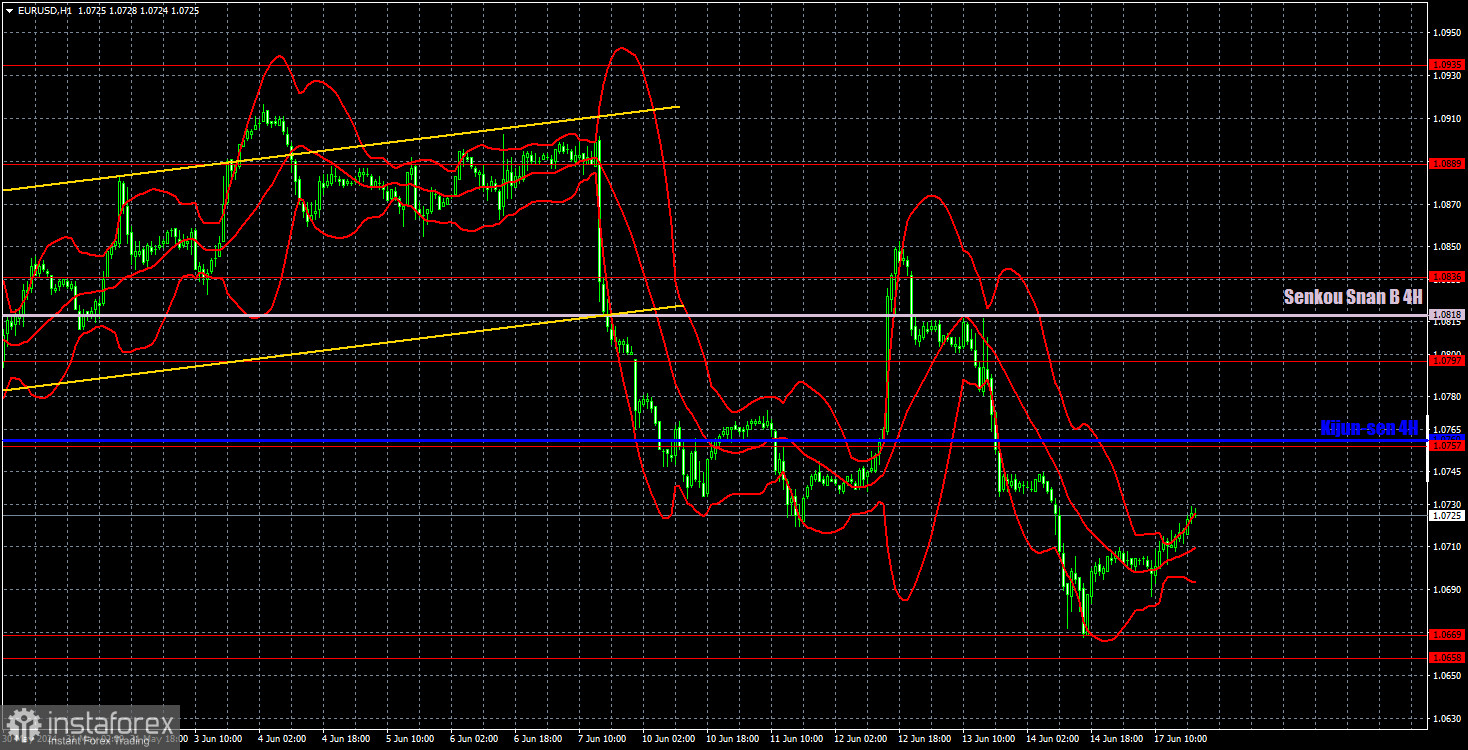
Analysis of EUR/USD 1H
On the 1-hour chart, EUR/USD finally has a real chance to form a new downward trend, which is part of the global trend. We still expect the single currency to fall but at this time, the pair is going through a technical correction. We don't expect the euro to fall every day. Most likely, the downward movement will be gradual. This is the nature of EUR/USD trading.
On June 18, we highlight the following levels for trading: 1.0530, 1.0581, 1.0658-1.0669, 1.0757, 1.0797, 1.0836, 1.0889, 1.0935, 1.1006, 1.1092, as well as the Senkou Span B (1.0818) and Kijun-sen (1.0760) lines. The Ichimoku indicator lines can move during the day, so this should be taken into account when identifying trading signals. Don't forget to set a Stop Loss to breakeven if the price has moved in the intended direction by 15 pips. This will protect you against potential losses if the signal turns out to be false.
On Tuesday, the European Union will release its inflation report for May. However, this is not crucial since it will be the second estimate. Although its value could differ from the first estimate, this rarely happens. If there is a discrepancy, it may trigger a market reaction. If inflation accelerates beyond 2.6%, the euro will likely rise further. Germany will publish the relatively unimportant ZEW economic sentiment indexes, while the U.S. will release relatively important reports on retail sales and industrial production. A minor market reaction to these data is also possible.
Description of the chart:
Support and resistance levels are thick red lines near which the trend may end. They do not provide trading signals;
The Kijun-sen and Senkou Span B lines are the lines of the Ichimoku indicator, plotted to the 1H timeframe from the 4H one. They provide trading signals;
Extreme levels are thin red lines from which the price bounced earlier. They provide trading signals;
Yellow lines are trend lines, trend channels, and any other technical patterns;
Indicator 1 on the COT charts is the net position size for each category of traders;