Analysis of EUR/USD 5M
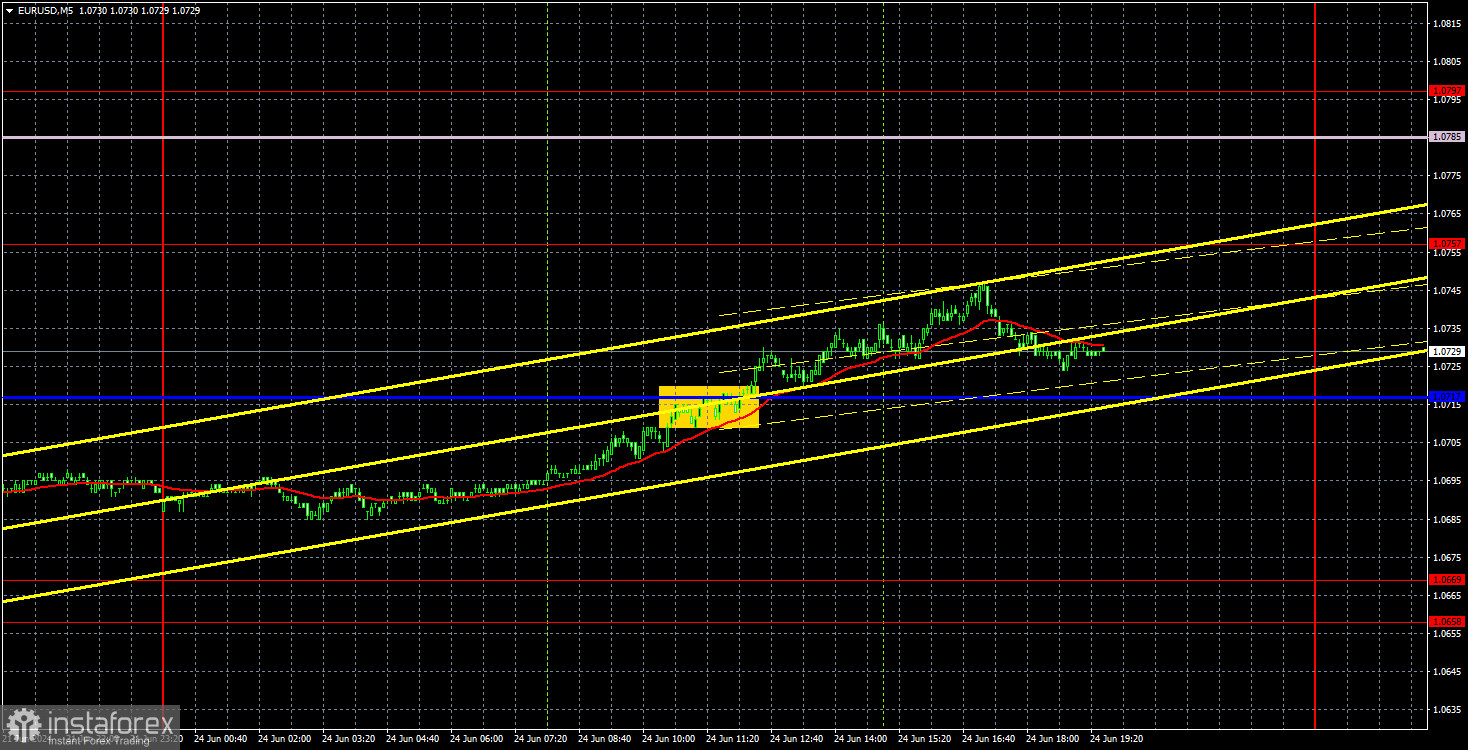
EUR/USD bounced on Monday and initiated a new corrective movement, failing to break through the 1.0669 level for the second time. This time, the price broke through the critical line and the trend line, but in our opinion, it is not yet the time to rush into buying. We believe that we are currently observing the second phase of the correction, after which the downtrend will resume. Take note that the correction could carry on for some time and it may be complex. Therefore, be prepared for the possibility that short positions might not be even opened this week.
On Monday, there were no significant reports or events in either the Eurozone or the United States. We can only mention a completely secondary IFO business climate index from Germany, which we won't even consider, as traders ignored this report. Overall, this week's news calendar only contains secondary reports. We don't even consider the US GDP report as crucial. Therefore, volatility might remain "near zero" for the next four days. Nonetheless, the global downtrend persists.
Only one trading signal was formed on Monday. During the European trading session, the price broke through the Kijun-sen line, after which it managed to rise by about 20 pips. Since no other trading signals were formed, this trade could have been closed manually in the evening. Alternatively, one could wait for the corrective movement to progress further so the price could at least reach the nearest target levels.
COT report:
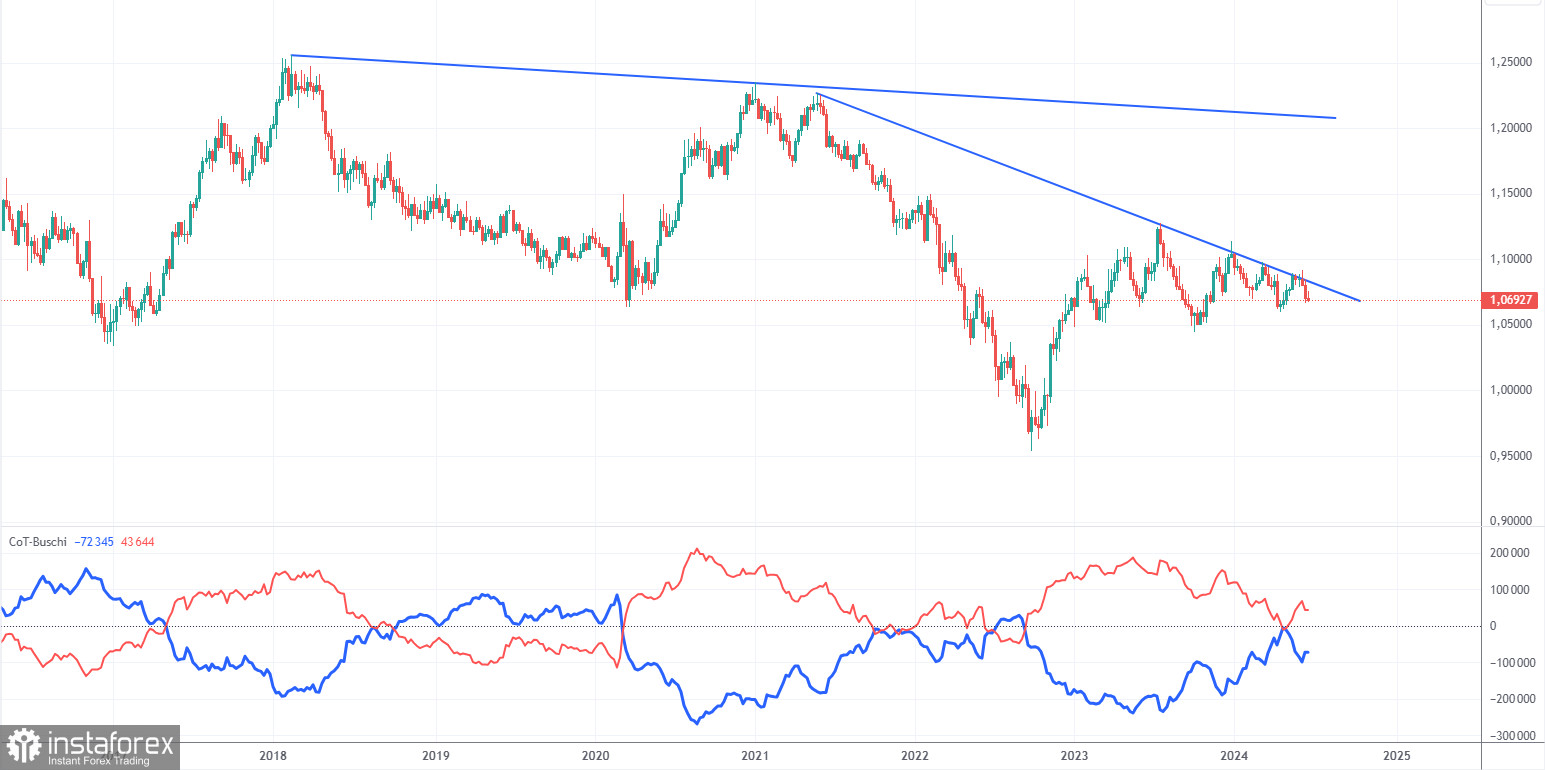
The latest COT report is dated June 11. The net position of non-commercial traders has remained bullish for a long time, and we're still dealing with the same situation. The bears' attempt to gain dominance failed miserably. The net position of non-commercial traders (red line) has been declining in recent months, while that of commercial traders (blue line) has been growing. But now we're seeing the opposite once again. This shows that buyers, not sellers, are currently gaining momentum again. This might be temporary since the downward trend is still valid.
We don't see any fundamental factors that can support the euro's strength in the long term, while technical analysis also suggests a continuation of the downtrend. Three descending trend lines on the weekly chart suggests that there's a good chance of further decline.
The red and blue lines are currently moving away from each other again, which indicates a build-up in long positions on the euro. During the last reporting week, the number of long positions for the non-commercial group decreased by 1,200, while the number of short positions increased by 23,000. Accordingly, the net position decreased by 14,200. We may witness the start of increasing bearish pressure. According to the COT reports, the euro has a lot of potential to fall.
Analysis of EUR/USD 1H
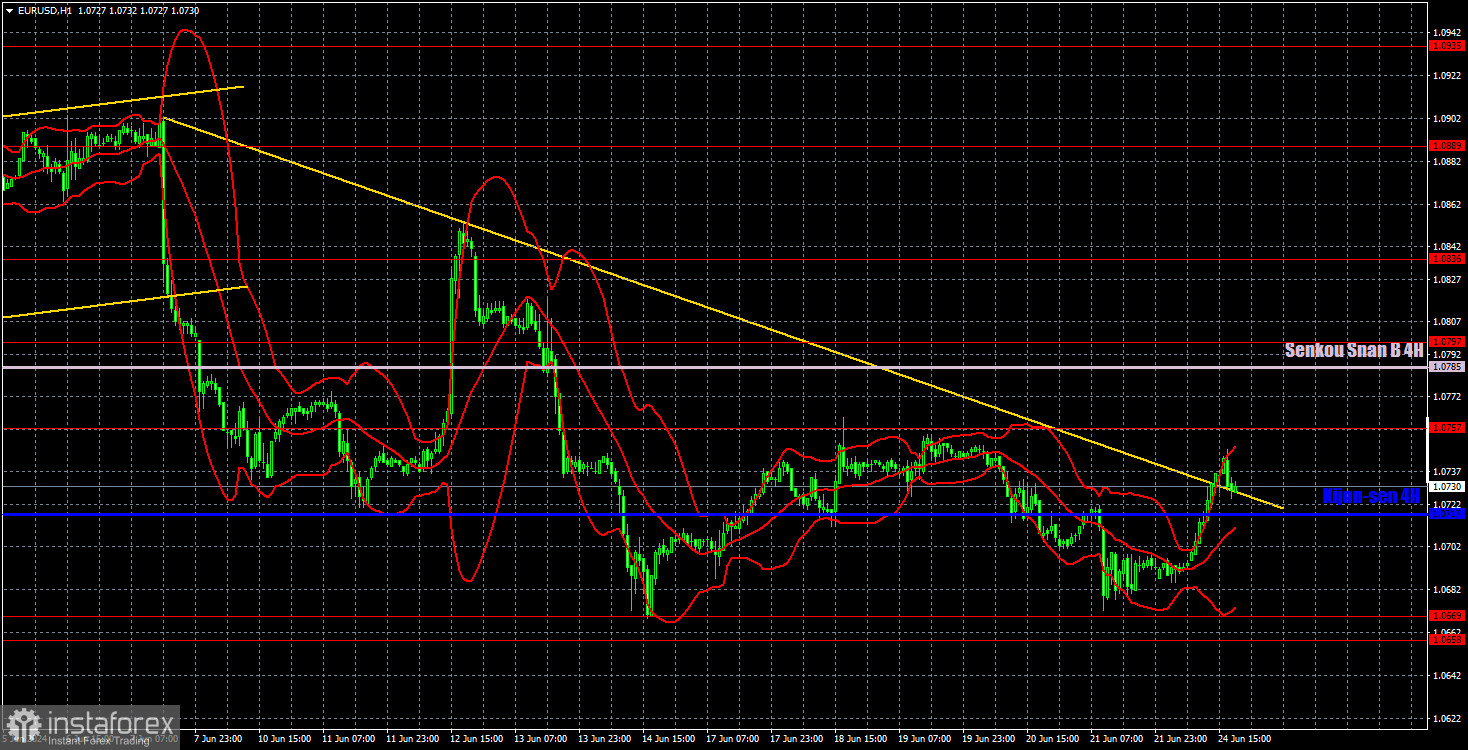
On the 1-hour chart, EUR/USD continues to form a new downtrend, which is part of the global trend. As before, we expect the single currency to fall, but the pair is currently going through a corrective movement, and it may last for another week or two. Volatility has once again dropped to absolute lows, making it quite difficult to conduct analysis and trading. Sell signals are required for a new wave of the downtrend, and there are currently none of those.
On June 25, we highlight the following levels for trading: 1.0530, 1.0581, 1.0658-1.0669, 1.0757, 1.0797, 1.0836, 1.0889, 1.0935, 1.1006, 1.1092, as well as the Senkou Span B line (1.0785) and the Kijun-sen line (1.0717). The Ichimoku indicator lines can move during the day, so this should be taken into account when identifying trading signals. Don't forget to set a Stop Loss to breakeven if the price has moved in the intended direction by 15 pips. This will protect you against potential losses if the signal turns out to be false.
On Tuesday, no important events are scheduled in either the US or the Eurozone. Not only was volatility extremely low on Monday, but there is no reason to expect strong movements on Tuesday either. The pair may edge lower, but then it will likely resume the correction.
Description of the chart:
Support and resistance levels are thick red lines near which the trend may end. They do not provide trading signals;
The Kijun-sen and Senkou Span B lines are the lines of the Ichimoku indicator, plotted to the 1H timeframe from the 4H one. They provide trading signals;
Extreme levels are thin red lines from which the price bounced earlier. They provide trading signals;
Yellow lines are trend lines, trend channels, and any other technical patterns;
Indicator 1 on the COT charts is the net position size for each category of traders;