Analysis of GBP/USD 5M
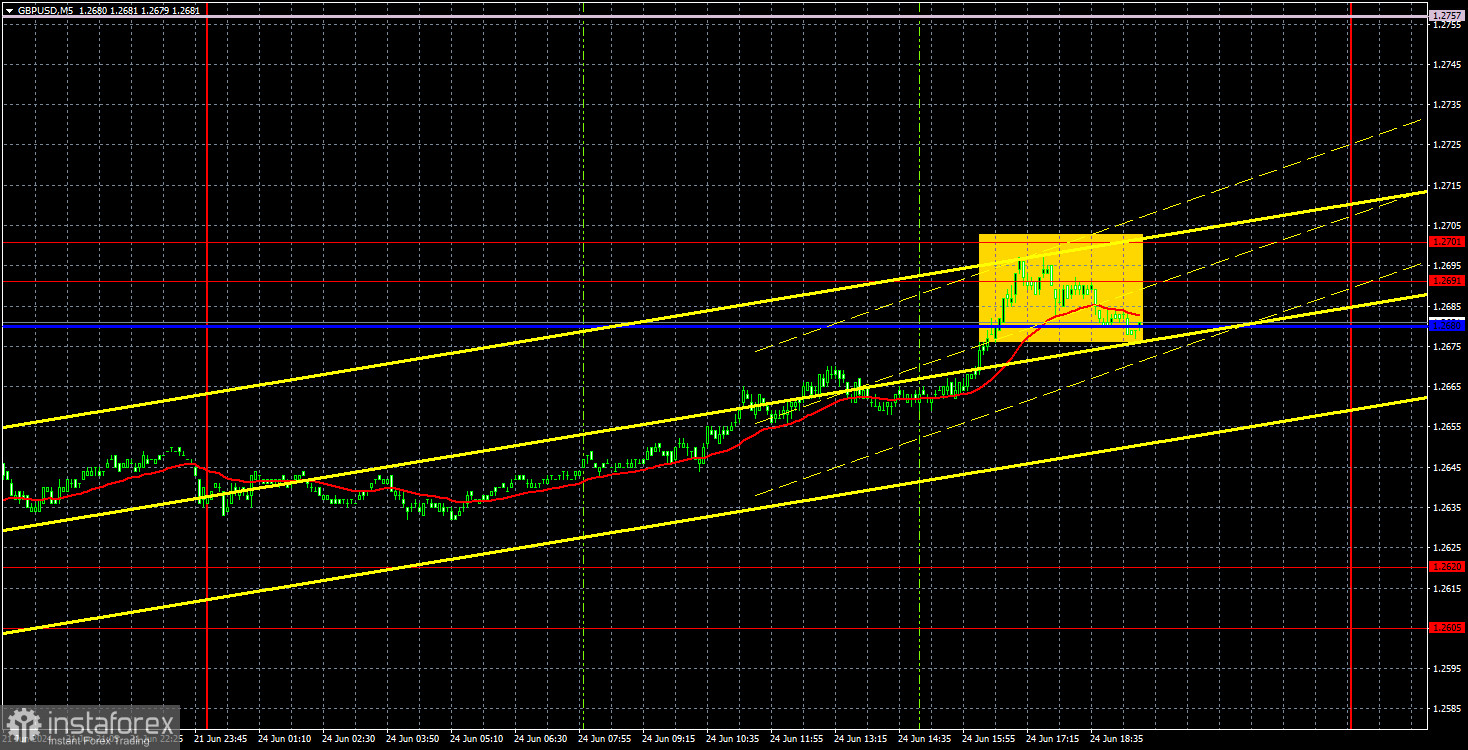
GBP/USD showed some slight bullish bias on Monday, which led to a consolidation above the descending trend line. However, as with the euro, this does not indicate a trend reversal, unlike the euro, though, we can hardly call the pound's movement a "trend." Formally, a downtrend has started, but it is so weak and unconvincing that it could end at any moment.
Yesterday, the pair, within the next corrective cycle, worked through the 1.2691-1.2701 area and bounced off it. Therefore, today we may observe a new wave of the downward movement. As a reminder, there has been almost no correlation between the euro and the pound in the last six months, so these currency pairs can freely move in different directions within the day. If the price overcomes the 1.2691-1.2701 area, the EUR/USD pair may correct higher.
On Monday, there were no interesting events in the US or the UK. The pound's growth was purely technical. And today, the decline could be just as technical. The British currency retains the potential to fall by several hundred pips, at least, but for now, these are just potential moves. The market is not in a rush to sell the pound, even if it has good reasons to do so.
Only one trading signal was formed on the 5-minute timeframe —a bounce from the 1.2691-1.2701 area. However, the price bounced off the 1.2605-1.2620 area on Friday, which triggered the pair's rise on Monday. Since volatility is very weak at this time, some trades can be carried over from one day to the next, which we usually do not recommend. The same applies to the sell signal around the 1.2691-1.2701 area.
As we can see, the movements are so weak at this time that one signal per day is still a very good outcome.
COT report:
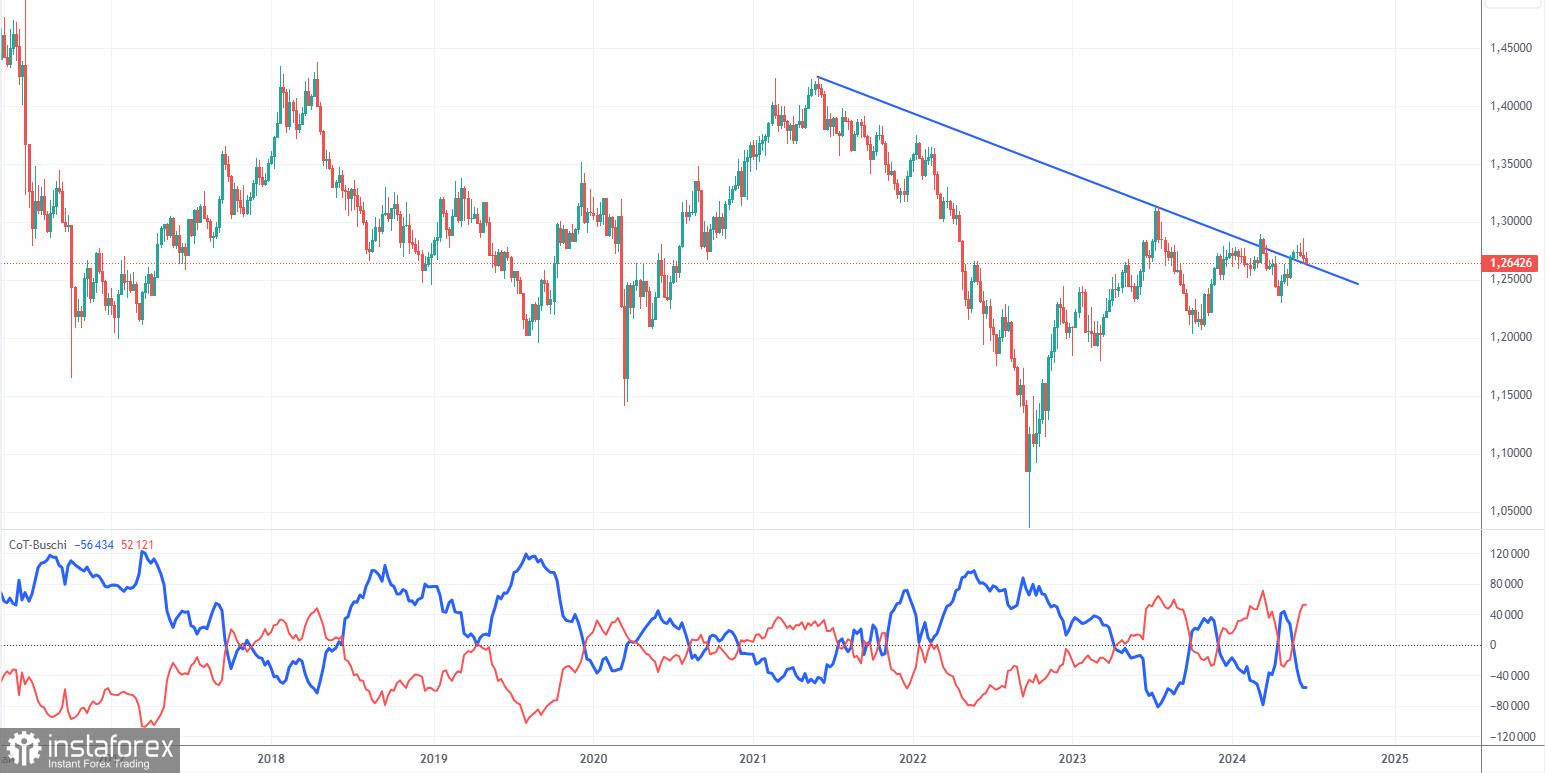
COT reports on the British pound show that the sentiment of commercial traders has frequently changed in recent years. The red and blue lines, which represent the net positions of commercial and non-commercial traders, constantly intersect and generally remain close to the zero mark. According to the latest report on the British pound, the non-commercial group opened 8,100 buy contracts and closed 700 short ones. As a result, the net position of non-commercial traders increased by 8,800 contracts over the week, which is quite significant for the pound. Thus, sellers failed to seize the initiative at the most critical moment.
The fundamental background still does not provide a basis for long-term purchases of the pound sterling, and the currency has a good chance to resume the global downward trend. However, the price has already breached the trend line on the 24-hour timeframe at least twice. The level of 1.2765 is currently preventing the pound from rising further.
The non-commercial group currently has a total of 110,300 buy contracts and 58,200 sell contracts. The bulls have taken the initiative, but aside from the COT reports, there is nothing else that suggests a potential rise in the GBP/USD pair.
Analysis of GBP/USD 1H
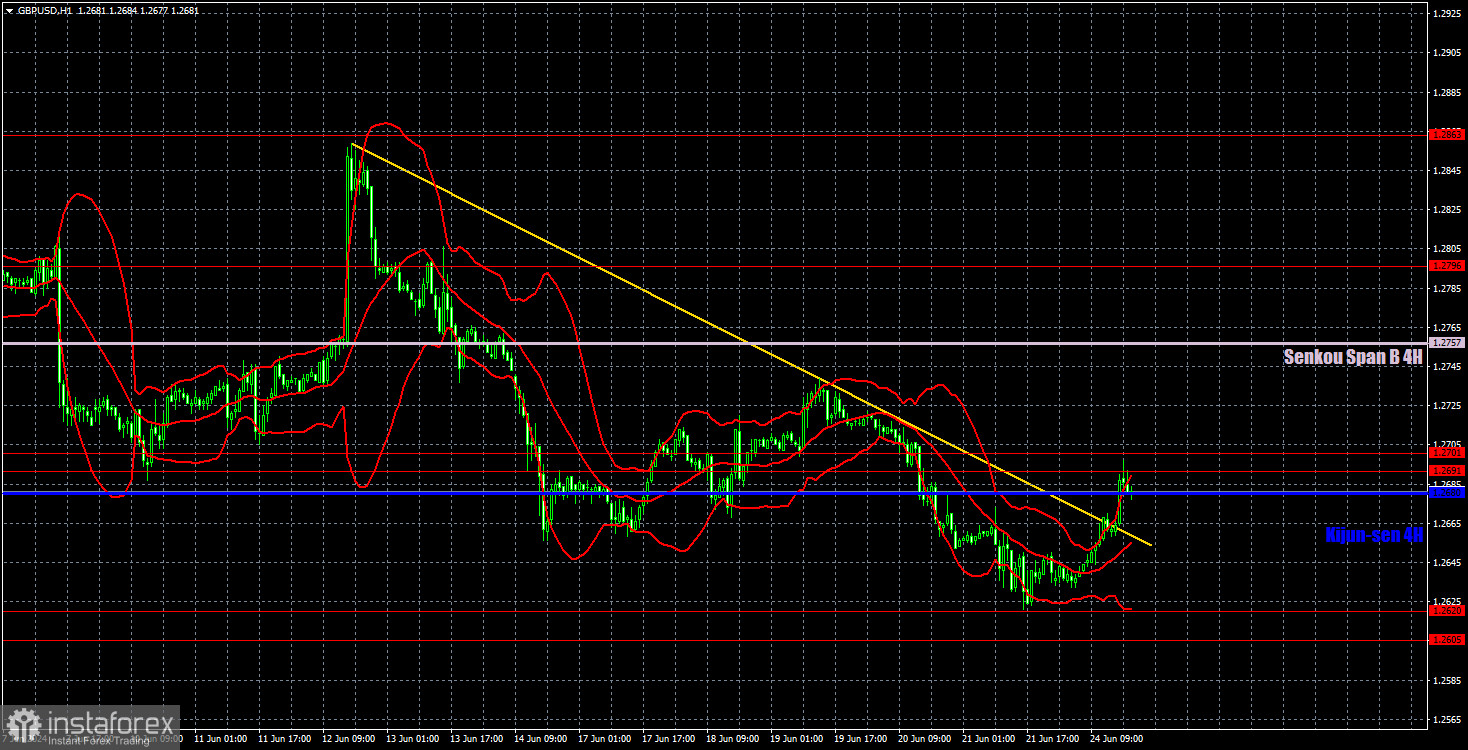
On the 1H chart, GBP/USD tried to start a new downward movement, but so far it looks as if it will end very quickly, as it has happened numerous times before. The price has consolidated below the 1.2691-1.2701 area for the second time and has also bounced off this area from below. However, the bearish bias remains weak, and so does the overall volatility. The pound sterling is moving downwards again, as if it's doing someone a favor, and we're unsure whether it will be able to overcome the 1.2605-1.2620 area.
As of June 25, we highlight the following important levels: 1.2215, 1.2269, 1.2349, 1.2429-1.2445, 1.2516, 1.2605-1.2620, 1.2691-1.2701, 1.2796, 1.2863, 1.2981-1.2987. The Senkou Span B (1.2757) and Kijun-sen (1.2680) lines can also serve as sources of signals. Don't forget to set a Stop Loss to breakeven if the price has moved in the intended direction by 20 pips. The Ichimoku indicator lines may move during the day, so this should be taken into account when determining trading signals.
On Tuesday, there are no important events or reports scheduled in the UK or the US. We believe that it is not worth expecting strong movements, and the price may return to the 1.2605-1.2620 area.
Description of the chart:
Support and resistance levels are thick red lines near which the trend may end. They do not provide trading signals;
The Kijun-sen and Senkou Span B lines are the lines of the Ichimoku indicator, plotted to the 1H timeframe from the 4H one. They provide trading signals;
Extreme levels are thin red lines from which the price bounced earlier. They provide trading signals;
Yellow lines are trend lines, trend channels, and any other technical patterns;
Indicator 1 on the COT charts is the net position size for each category of traders;