Analyzing Tuesday's trades:
GBP/USD on 1H chart
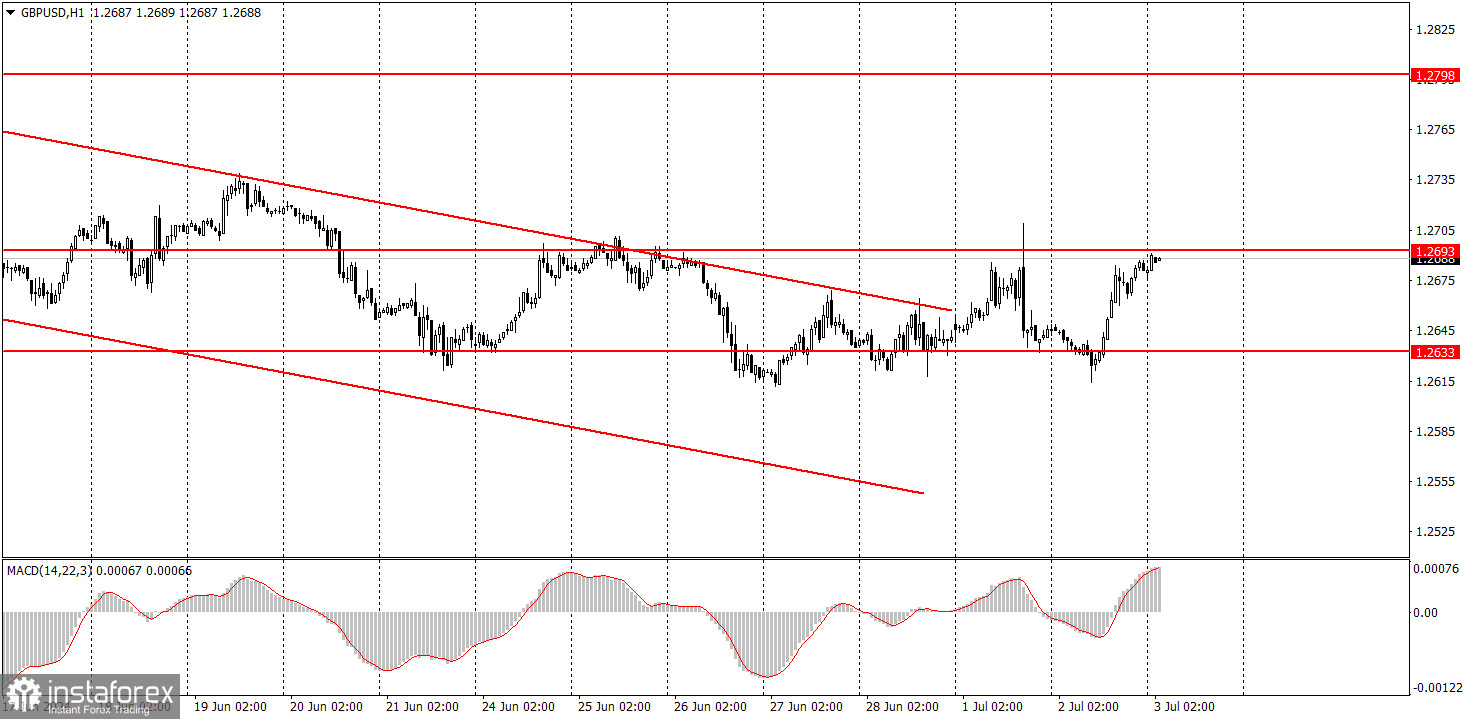
Yesterday, GBP/USD showed gains within the horizontal channel. The lower boundary of this channel is below the 1.2633 level, which is clearly visible on the 5-minute timeframe. The price has bounced off this area for the fifth time but still cannot break through the upper boundary. The pound rose without the help of the fundamental or macroeconomic background. Federal Reserve Chair Jerome Powell did not provide the market with any new information, and the JOLTs report in the US unexpectedly rose, which should have triggered the pair's decline. However, the market, as usual, did not see the positive aspect of the report but focused on the negative instead – the previous month's JOLTs report was revised downward. Nevertheless, all these data are irrelevant since the GBP/USD pair is showing flat dynamics.
GBP/USD on 5M chart
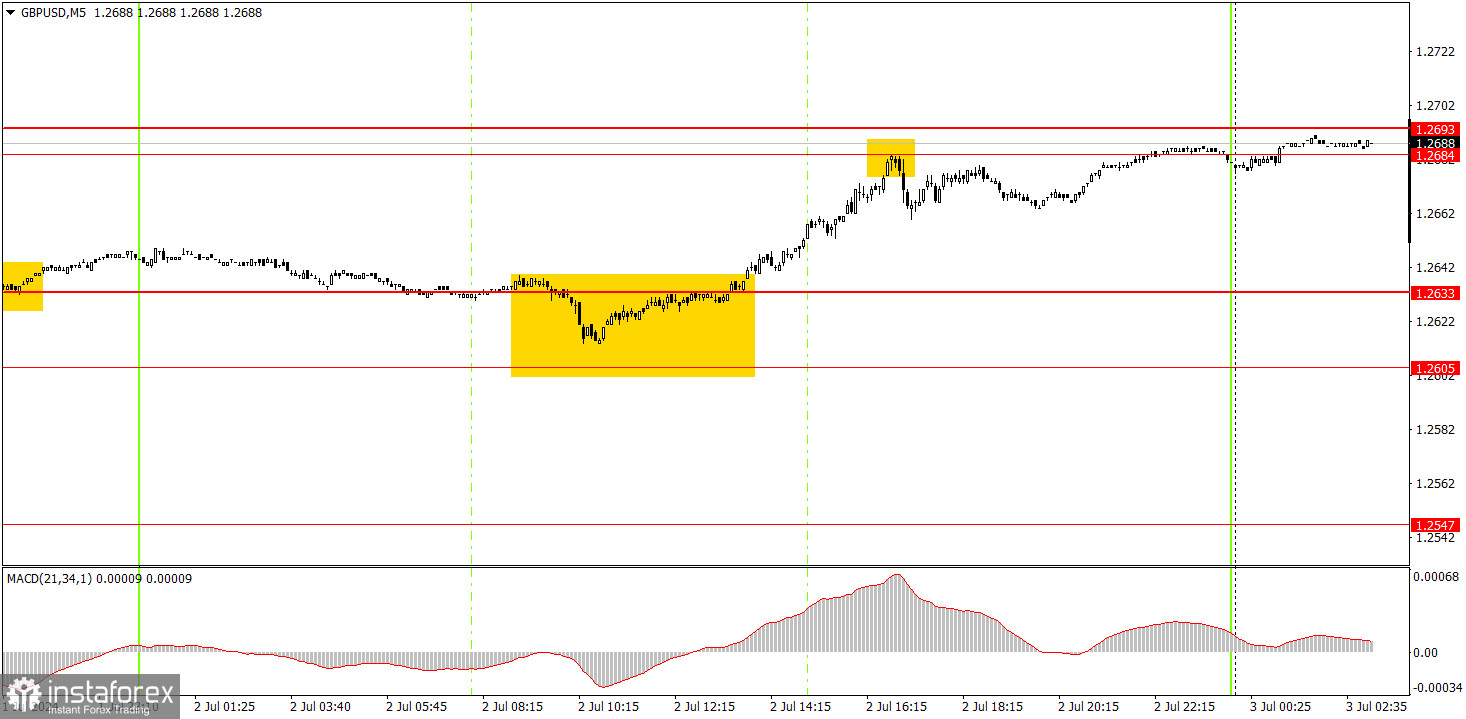
A buy signal was formed on the 5-minute timeframe. During the European trading session, the price bounced off the 1.2605-1.2633 area and it managed to rise to the nearest target area of 1.2684-1.2693. The pair actually showed good volatility. The main thing is that at least one trading signal was formed, so the price was able to reach the target. The bounce from the 1.2684-1.2693 area could also have been executed. The pair has a good chance of moving back to the lower boundary of the channel.
Trading tips on Wednesday:
On the hourly chart, GBP/USD continues to show promising signs of forming a downtrend, but this doesn't mean that the pair can't form an upward trend. The pair has been seeing a lot of sideways actions in recent weeks. Traders are clearly dealing with another flat market with all its implications. The British pound remains overbought and unjustifiably expensive, but the market simply ignores this.
Today, the British pound may continue to exhibit erratic and illogical movements. The day could be marked by sideways and sluggish movement. The first two days of the week showed us that even in the presence of important events and reports, the market is not yet ready to leave the flat phase. We advise you to trade on bounces from the boundaries of the horizontal channel.
The key levels on the 5M chart are 1.2457, 1.2502, 1.2541-1.2547, 1.2605-1.2633, 1.2684-1.2693, 1.2748, 1.2791-1.2798, 1.2848-1.2860, 1.2913, 1.2980. On Wednesday, the UK will post the second estimate of the Services PMI for June, while the US will release important ISM and ADP reports, as well as secondary data on unemployment claims and the minutes of the Federal Reserve meeting. However, even such reports may not affect volatility and the flat market.
Basic trading rules:
1) Signal strength is determined by the time taken for its formation (either a bounce or level breach). A shorter formation time indicates a stronger signal.
2) If two or more trades around a certain level are initiated based on false signals, subsequent signals from that level should be disregarded.
3) In a flat market, any currency pair can produce multiple false signals or none at all. In any case, the flat trend is not the best condition for trading.
4) Trading activities are confined between the onset of the European session and mid-way through the U.S. session, after which all open trades should be manually closed.
5) On the 30-minute timeframe, trades based on MACD signals are only advisable amidst substantial volatility and an established trend, confirmed either by a trendline or trend channel.
6) If two levels lie closely together (ranging from 5 to 15 pips apart), they should be considered as a support or resistance zone.
How to read charts:
Support and Resistance price levels can serve as targets when buying or selling. You can place Take Profit levels near them.
Red lines represent channels or trend lines, depicting the current market trend and indicating the preferable trading direction.
The MACD(14,22,3) indicator, encompassing both the histogram and signal line, acts as an auxiliary tool and can also be used as a signal source.
Significant speeches and reports (always noted in the news calendar) can profoundly influence the price dynamics. Hence, trading during their release calls for heightened caution. It may be reasonable to exit the market to prevent abrupt price reversals against the prevailing trend.
Beginners should always remember that not every trade will yield profit. Establishing a clear strategy coupled with sound money management is the cornerstone of sustained trading success.