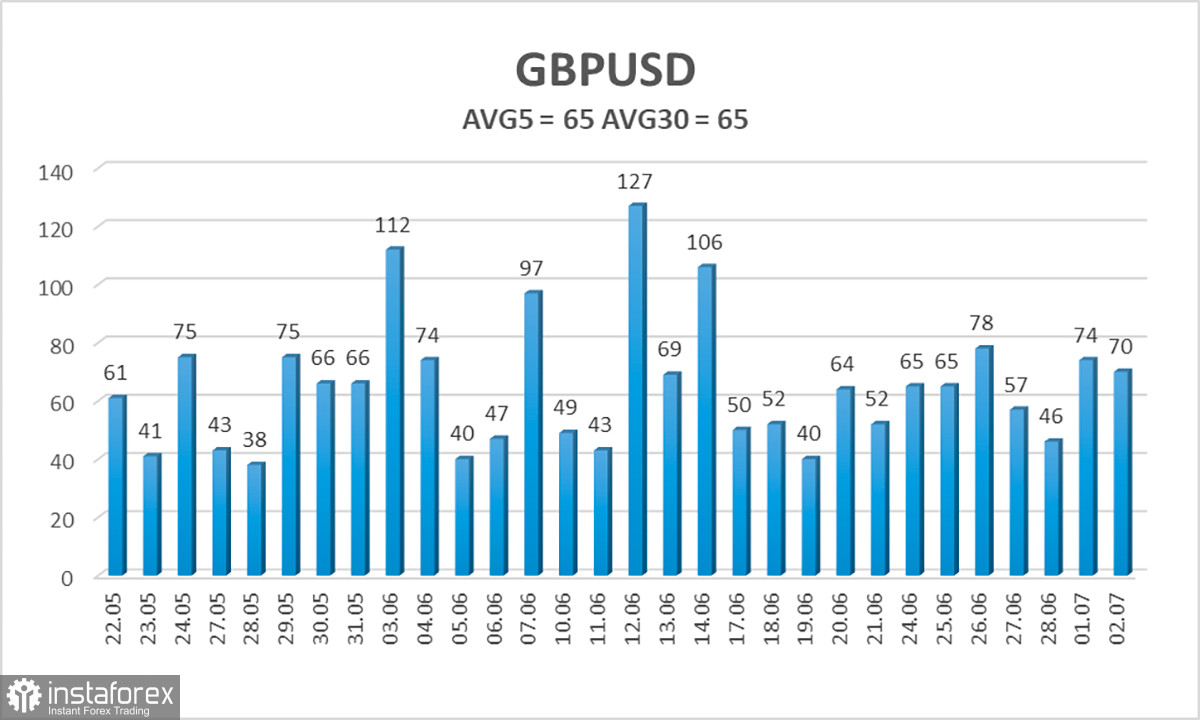
GBP/USD continued to trade in its usual manner on Tuesday. As expected, volatility was low, but we've been talking about this for more than half a year now. What else is there to discuss when in half of the cases the pair moves around 60 pips in a day? Of course, even with a 60-pip movement, trades can be opened and profits made, but the former volatility (observed a year or two ago) is nowhere to be seen. The normal value for the pound has always been 100 pips but now we struggle to reach 60-65 pips a day.
The nature of the movement also lacks logic. On Monday, the pair surged out of nowhere. We can understand why the euro rose on Monday, but what do the election results in France have to do with the pound? On Tuesday, the pound stayed in one place throughout the European session, and during the US session, it suddenly shot up for no apparent reason. However, intraday movements cannot affect the overall technical picture, so let's examine it.
Unfortunately, there is nothing optimistic to highlight. The pair found a new low around the level of 1.2620 and now it consistently fails to overcome this mark. The new downtrend, which had just begun, may quickly come to an end. It is very difficult to imagine what could cause the British currency to rise again on a global scale. The current situation is best seen on the day timeframe. Since November 14, 2023 (almost nine months now), the pair has been trading between the levels of 1.23 and 1.28. That means we've been facing a global flat for three quarters. The pound has no grounds for growth or to remain so expensive either. However, the market (or its big players) still refuses to sell the pound, so we haven't seen any logical movement for a very long time.
On Monday, the head of the Chicago Federal Reserve, Austan Goolsbee, said he "saw" inflation moving towards 2%. Honestly, it's hard for us to understand what Goolsbee is seeing if US inflation fell to 3% last summer and has not dropped below that level since. The last two months ended with a slowdown of 0.1%. The current inflation level is 3.3%. At this rate, it will take another year for inflation to approach levels where it makes sense to start talking about easing monetary policy.
All this tells us that the Fed's rate will remain at its peak level for a long time. Of course, the dollar should be appreciating against such a fundamental backdrop, but it isn't. The Bank of England may begin easing its monetary policy at the next meeting, but it appears that market participants are taking this lightly. It has been quite difficult for the pound to achieve new local support levels. It seems that this is a futile task for the bears.
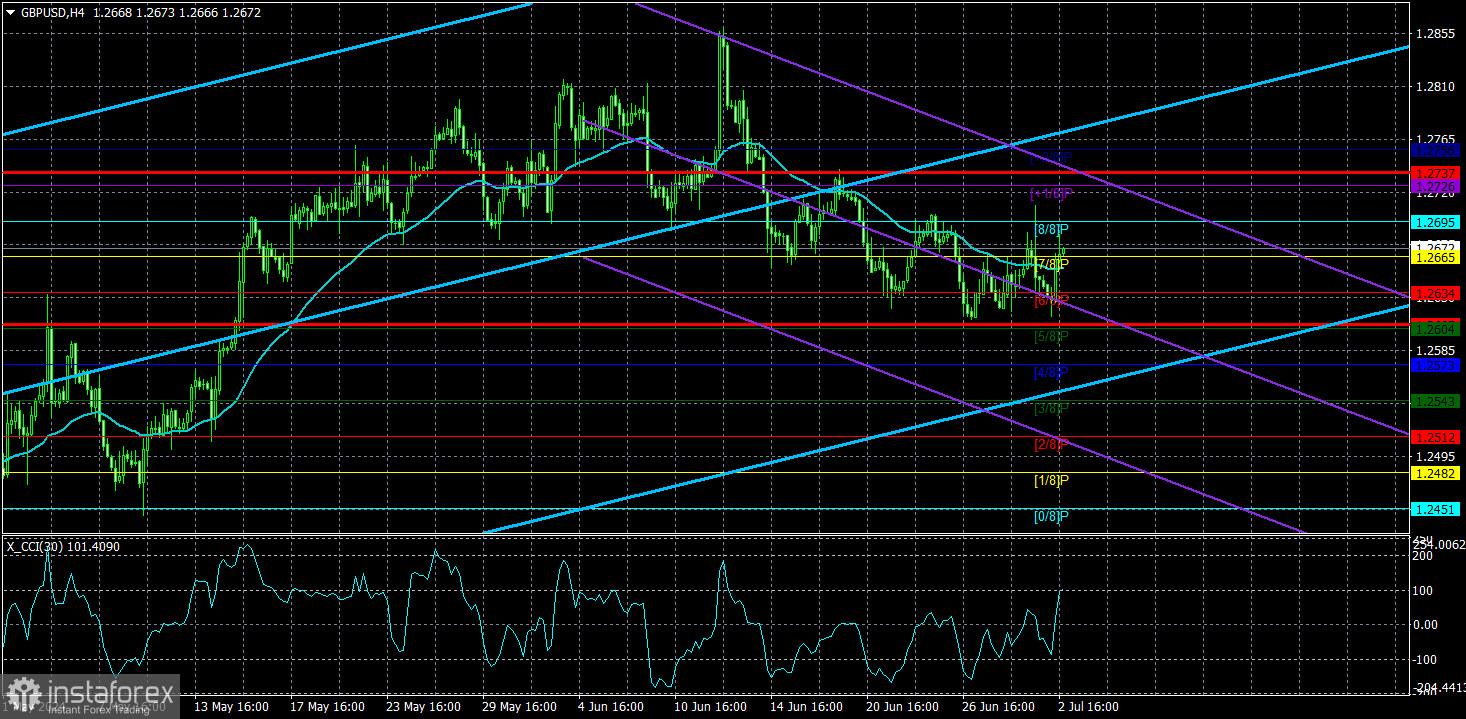
The average volatility of GBP/USD over the last five trading days is 65 pips. This is considered a "moderately low" value for the pair. Today, we expect GBP/USD to move within a range bounded by the levels of 1.2607 and 1.2737. The higher linear regression channel is pointing upwards, which suggests that the upward trend will continue. The CCI indicator entered the overbought and oversold areas recently.
Nearest support levels:
S1 - 1.2665
S2 - 1.2634
S3 - 1.2604
Nearest resistance levels:
R1 - 1.2695
R2 - 1.2726
R3 - 1.2756
Trading Recommendations:
The GBP/USD pair has once again consolidated above the moving average line. In recent weeks, the price has been trading flat and is constantly changing direction. After consolidating below the moving average line and overcoming the area of 1.2680-1.2695, the pound has better chances of falling further, but the market is not in a hurry to sell. Traders should be cautious with any positions on the British currency. There is still no reason to buy it, and it is also risky to sell, because the market ignored the fundamental and macroeconomic background for two months, and often refuses to sell the pair. Nevertheless, traders may consider short positions with targets of 1.2604 and 1.2573, if we are talking about a logical and natural movement.
Explanation of Illustrations:
- Linear Regression Channels – Helps determine the current trend. If both are directed in the same direction, it means the trend is currently strong.
- Moving Average Line (settings 20.0, smoothed) – Determines the short-term trend and the direction in which trading should currently be conducted.
- Murray Levels – Target levels for movements and corrections.
- Volatility Levels (red lines) – The probable price channel in which the pair will spend the next day, based on current volatility indicators.
- CCI Indicator – Its entry into the oversold area (below -250) or the overbought area (above +250) means that a trend reversal in the opposite direction is imminent.