Analyzing Monday's trades:
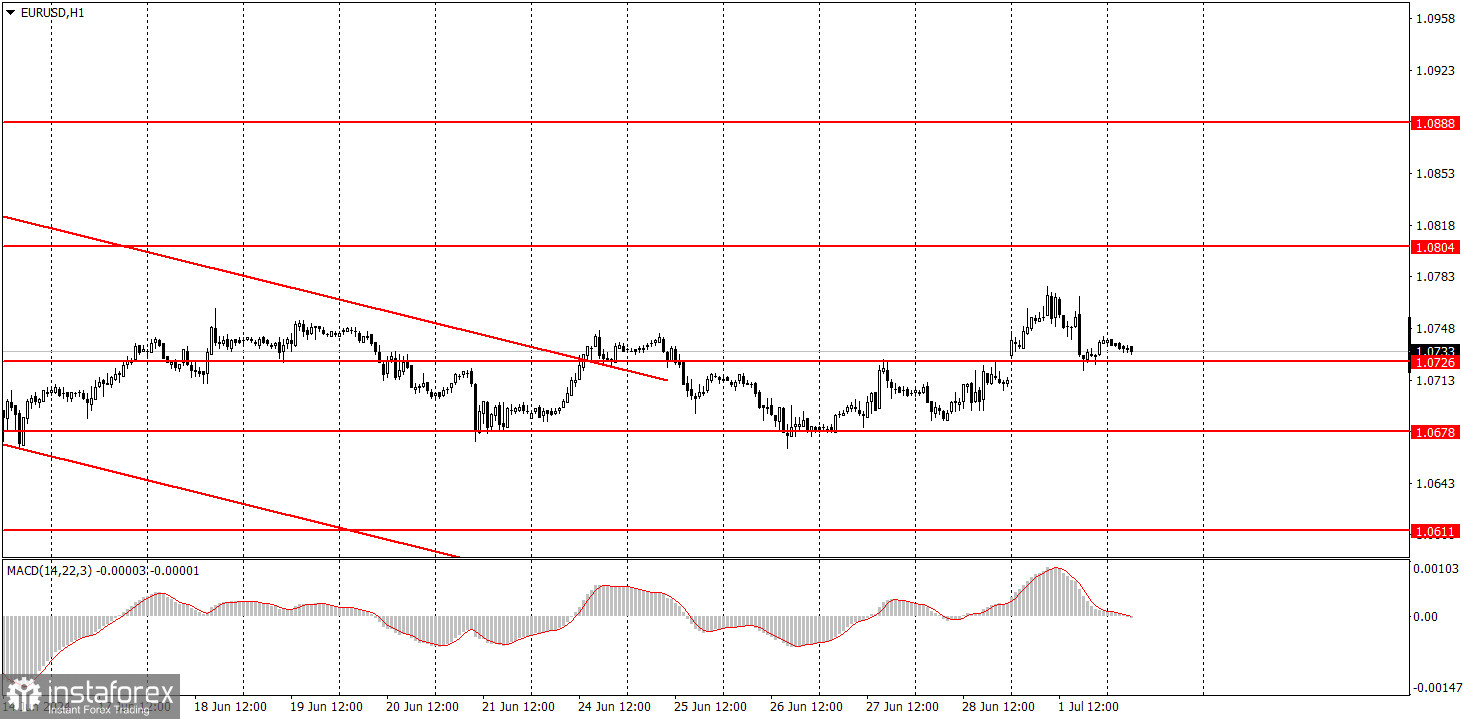
EUR/USD on 1H chart
Yesterday, EUR/USD suddenly rose, and it took quite some time to understand what triggered this movement. However, by midday, it became clear that the surge was caused by the results of the first round of elections in France. We believe that political news should not influence a currency pair's movements, but occasionally it does happen. The issue with yesterday was that it was impossible to definitively say whether the results of the first round of elections were negative or positive for the euro. Therefore, the reaction could have been anything or there might not have been any reaction at all.
It's also worth noting that consumer prices in Germany dropped back to 2.2% at an annual pace in June. This is likely bad news for the euro, as it brings the European Central Bank closer to another rate cut in September. In the second half of the day, the pair returned to its original position even without the help of macro data.
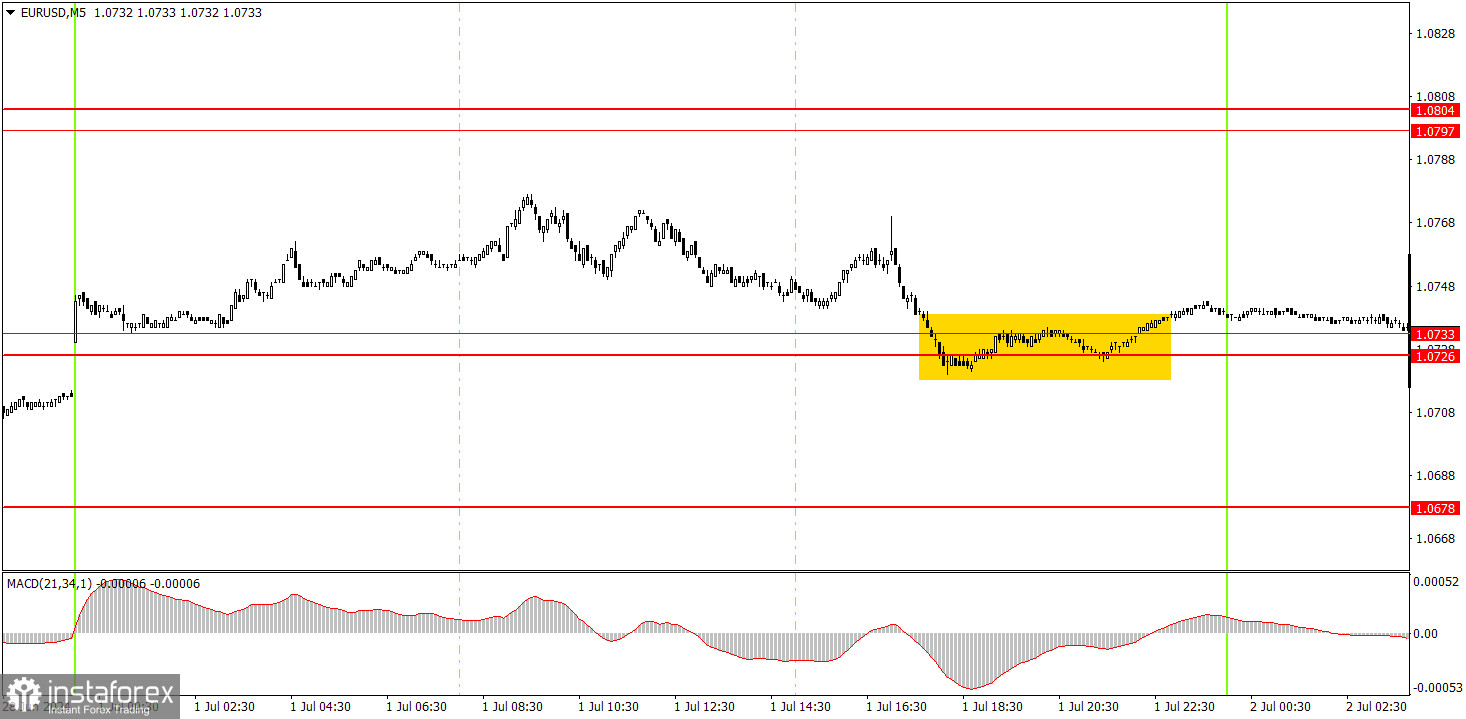
EUR/USD on 5M chart
The pair did not form any signal on the 5-minute timeframe. Towards the end of the day, the pair returned to the area of 1.0726-1.0733, from which it can be said to have rebounded. A similar buy signal was formed late Sunday night, but obviously it was difficult to act on it. Take note that the pair could show erratic movements this week due to the large number of important events and reports.
Trading tips on Tuesday:
On the hourly chart, EUR/USD is forming a local downward trend, but the pair is currently going through a correction and trading within a horizontal channel. We still expect the pair to drop to levels like 1.0600, 1.0450, and even 1.0200. However, it's important to understand that the price will not reach these targets immediately; they are medium-term objectives. For instance, the pair could go through a corrective phase for another week, as the price has not breached the level of 1.0678 even after three attempts. Nonetheless, we don't see any reasons for the euro to rise in the medium-term.
On Tuesday, traders can expect the euro to fall to the 1.0678 level if the price breaks through the 1.0726-1.0733 area. However, it's important to remember that EUR/USD may show erratic sideways movements.
The key levels on the 5M chart are 1.0483, 1.0526, 1.0568, 1.0611, 1.0678, 1.0726-1.0733, 1.0797-1.0804, 1.0838-1 should be considered. 0856, 1.0888-1.0896, 1.0940, 1.0971-1.0981. In the Eurozone, the inflation report for June will be released, and ECB President Christine Lagarde will speak. Both events can provoke a weak market reaction. The US docket will feature Fed Chairman Jerome Powell's speech and the JOLTs report.
Basic trading rules:
1) Signal strength is determined by the time taken for its formation (either a bounce or level breach). A shorter formation time indicates a stronger signal.
2) If two or more trades around a certain level are initiated based on false signals, subsequent signals from that level should be disregarded.
3) In a flat market, any currency pair can produce multiple false signals or none at all. In any case, the flat trend is not the best condition for trading.
4) Trading activities are confined between the onset of the European session and mid-way through the U.S. session, after which all open trades should be manually closed.
5) On the 30-minute timeframe, trades based on MACD signals are only advisable amidst substantial volatility and an established trend, confirmed either by a trendline or trend channel.
6) If two levels lie closely together (ranging from 5 to 15 pips apart), they should be considered as a support or resistance zone.
How to read charts:
Support and Resistance price levels can serve as targets when buying or selling. You can place Take Profit levels near them.
Red lines represent channels or trend lines, depicting the current market trend and indicating the preferable trading direction.
The MACD(14,22,3) indicator, encompassing both the histogram and signal line, acts as an auxiliary tool and can also be used as a signal source.
Significant speeches and reports (always noted in the news calendar) can profoundly influence the price dynamics. Hence, trading during their release calls for heightened caution. It may be reasonable to exit the market to prevent abrupt price reversals against the prevailing trend.
Beginners should always remember that not every trade will yield profit. Establishing a clear strategy coupled with sound money management is the cornerstone of sustained trading success.